
Fishbone Diagram
The Fishbone Diagram, also known as the Ishikawa or Cause-and-Effect Diagram, is a powerful tool used for identifying and analyzing the root causes of a problem. This document provides an overview of the Fishbone Diagram, its components, and its applications in problem-solving and quality management. By visually mapping out the potential causes of an issue, teams can systematically explore various factors that contribute to a problem, leading to more effective solutions.
What is a Fishbone Diagram?
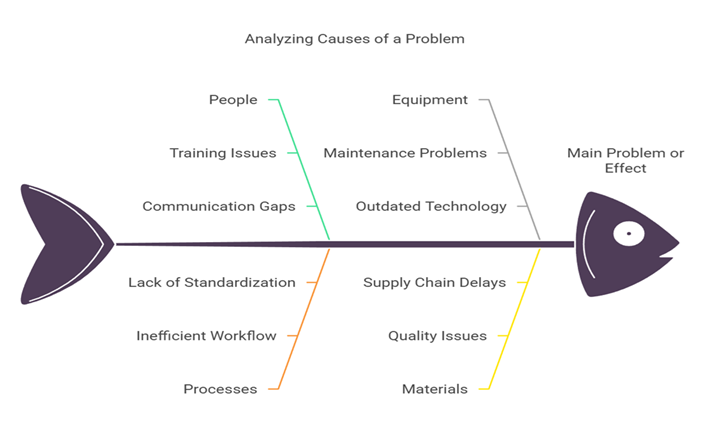
A Fishbone Diagram is a visual representation that resembles the skeleton of a fish. It helps teams identify, explore, and display the various potential causes of a specific problem or effect. The main “bone” of the fish represents the problem, while the smaller “bones” branching off represent different categories of causes. This diagram is particularly useful in quality control and process improvement initiatives.
What is a Fishbone Diagram?
Components of a Fishbone Diagram
- Head: The head of the fish represents the main problem or effect that needs to be analyzed.
- Spine: The central line of the diagram that connects the head to the various categories of causes.
- Bones: The major categories of causes that contribute to the problem. Common categories include:
- People
- Processes
- Equipment
- Materials
- Environment
- Management
- Sub-bones: These are the specific causes that fall under each category, providing a more detailed breakdown of potential issues.
How to Create a Fishbone Diagram
- Define the Problem: Clearly state the problem or effect you want to analyze and write it in the head of the fish.
- Identify Major Categories: Determine the main categories of causes that could contribute to the problem and draw them as branches off the spine.
- Brainstorm Causes: For each category, brainstorm potential causes and add them as sub-bones. Encourage team members to think creatively and consider all possibilities.
- Analyze and Prioritize: Once all potential causes are listed, analyze them to identify the most likely root causes. Prioritize these causes for further investigation or action.
Applications of Fishbone Diagrams
- Quality Improvement: Used in Six Sigma and Total Quality Management (TQM) to identify defects and improve processes.
- Problem Solving: Helps teams systematically explore issues in various fields, including manufacturing, healthcare, and service industries.
- Project Management: Assists in identifying risks and challenges that could impact project outcomes.
Conclusion
The Fishbone Diagram is an invaluable tool for teams looking to understand the root causes of problems and develop effective solutions. By visually organizing potential causes, teams can foster collaboration, enhance communication, and drive continuous improvement in their processes. Whether in quality management, project management, or general problem-solving, the Fishbone Diagram remains a fundamental technique for achieving better outcomes.